Find the right solution for your business with our free Fleet Management Buyer’s Guide.
Resolve to Be a Best-in-Class Fleet in 2019
With the transition from one calendar year to the next, people commonly make resolutions to improve their health, well-being, organizational skills, time management and more. But it’s as good a time as any to reflect on how to make improvements in business as well, whether it’s around a specific position or for the company as a whole. For commercial fleets, this year is a great time to finally get a grasp on metrics and aim to become a best-in-class fleet.
What it means to be “best-in-class”
This past year, we published our 2018 Verizon Connect Fleet Technology Trends Report, based on a survey of field service companies conducted by Verizon Connect and Bobit Business Media, incorporating the knowledge we’ve gained by virtue of millions of data points from hundreds of thousands of connected commercial vehicles moving across our network every day.
Looking at the impact of fleet management software on driver behavior and operational efficiency in field service businesses, the report found that data-driven fleets saw more measurable improvements in safety, cost control and productivity with increased use of their telematics functionalities. In particular, they had success in:
- Leveraging fleet management software for enhanced connectivity and visibility
- Achieving improved operational efficiencies as a result of data-based gains
- Improving driver behavior based on technology monitoring capabilities
But simply realizing these benefits doesn’t make a fleet “best-in-class.” That’s because best-in-class has to do with how well companies, fleet managers and the fleets themselves utilize these benefits, and others, once they realize them. And specifically, that means looking closely at how organizations use technology to manage idle time and stops per hour.
There are laggard performers, average performers and best-in-class performers. Where your organization falls on this spectrum impacts how well prepared your fleet is to excel in 2019 and beyond.
Best-in-class by the numbers
Best-in-class fleets use data-driven technology to identify trends, establish benchmarks, coach behavior and examine changes over time in key operational areas. But those who have embraced a fleet management solution to take full advantage of how it can impact idle time and stops per hour are the ones with the highest utilization rates1:
- Utilization among best-in-class fleets (top 20%)
- Utilization among average fleets (middle 60%)
- Utilization among laggard performers (bottom 20%)
Knowing and understanding specific benchmarks can help your company, and fleet, learn how to power down the path toward best-in-class status (if you’re not already there). That’s why we’re highlighting the specifics behind idle time and stops per hour.
Idling
Idling literally allows your profits to go up in fumes. That’s because an idling vehicle can waste a half-gallon of fuel in one-half hour.2 For a company with 10 vehicles where each driver completes five jobs per day and idles for 10 minutes before and after the job, this would equal approximately 7.5 gallons of wasted fuel a day.3 Now imagine how many wasted gallons that would be for larger fleets—and that’s hardly the only cost of idling. Idling can even lead to financial consequences. Municipalities across the United States have rolled out anti-idling regulations ranging from a fine of $50 to a find of thousands of dollars.4
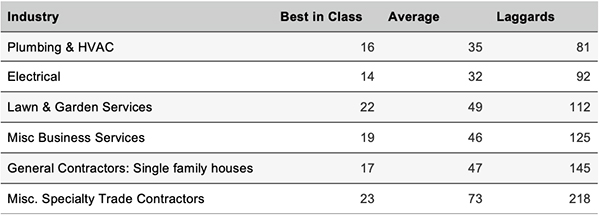
This is where fleet management technology comes in. No matter the industry, successfully leveraging data-driven telematics solutions can have a positive impact on idling hours, with a clear difference for best-in-class organizations.
Average Idling Minutes Hours per Day by Industry1

Stops per hour
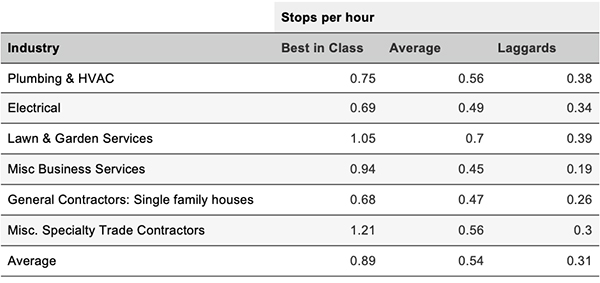
The more jobs per day (and stops per hour) a fleet can achieve, the more opportunity an organization has to make a profit. And like idling, there’s a notable difference between the performance of fleets that are leveraging fleet management more regularly and those that aren’t:
- The majority makes an average of .56 stops/hour
- The best-in-class make .89 stops/hour, while the laggards only make .38 stops/hour
- In an 8-hour workday, that would equate to nearly three times as many stops for top performers (7.09 stops/day) vs. laggards (2.48 stops/day)
Again, as with idling, this is where fleet management technology makes a difference. Across industries, there is again a definite leg up for best-in-class organizations making the most of telematics solutions.
Stops Per Hour by Industry1

Leverage technology to bolster your fleet
New Year’s resolutions are often about creating better versions of ourselves. For fleets, that means doing everything you can to stay competitive and future-ready. Investing in, or upgrading, fleet management technology is a great place to start.
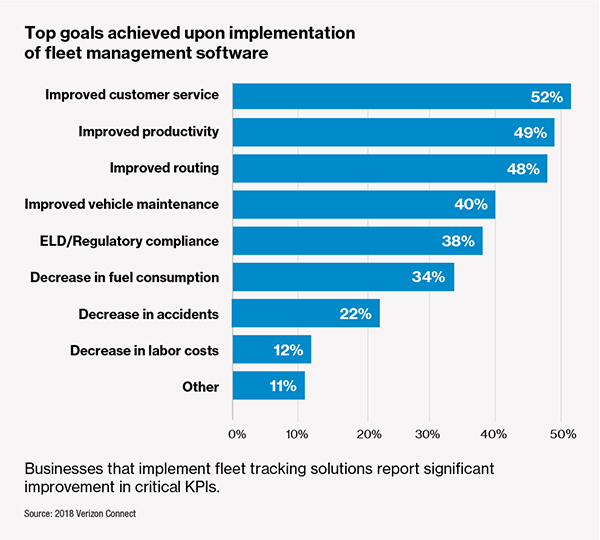
Not only can fleet management software help improve critical benchmarks involved with reaching a best-in-class status, the software can also help all fleets realize improvements across many critical KPIs.
Top goals achieved1

With all these benefits, it stands to reason that 97% of organizations using telematics consider it beneficial and 38% of those who’ve employed a fleet management solution realized a positive ROI in under a year, with average decreases in costs linked to overall spend:1
- 13% (fuel costs)
- 25% (accident costs)
- 17% (labor costs)
Verizon Connect's top-ranked fleet management technology can help you make steps toward future-proofing your business and becoming the best fleet it can be. You can also learn from others who have gone before you, like Witmer’s Feed and Grain which is using fleet management software to gain ground on becoming a best-in-class fleet.
Witmer’s is an Ohio-based feed supplier that delivers feed throughout Ohio, Pennsylvania, New York and West Virginia. They needed a more efficient way to keep feed flowing from storage bins into waiting delivery trucks and turned to fleet management technology. Post-rollout, they realized significant operational improvements
- Staff could track truck locations and estimated arrival times at the feed mill
- For customer-requested backhauls of grain, dispatchers could locate the closest truck
- Productivity and customer satisfaction greatly improved
Sources
12018 Verizon Connect Fleet Technology Trends Report
3 https://www.fleetmatics.com/resources/article/costs-of-engine-idling
4 https://archive.epa.gov/reg3artd/archive/web/html/anti_idling_regs.html
Find out how our platform gives you the visibility you need to get more done.


