
Find the right solution for your business with our free Fleet Management Buyer’s Guide.
Tales from the Road: Revenue
You probably already know that the LogBook platform can help your drivers stay safe and compliant, but did you know that it can help you make more money? Over 40% of surveyed the LogBook platform customers have already improved against key revenue goals using the LogBook platforms. How are they doing it?
“It allows drivers to move stop to stop faster.” – Kent Vedder, Fleet Manager, Casa Imports, Inc.
Your drivers can get more done when you’re able to plan more efficiently and improve drop-off times. Now you can identify customers with long drop-off times and have conversations with your customers based on facts – allowing you to improve drop-off times and bill the customer accordingly. For the customers that deal with the unavoidable long drop-off times, your schedulers and dispatchers can know in advance and make appropriate plans.
Here’s how simple it is
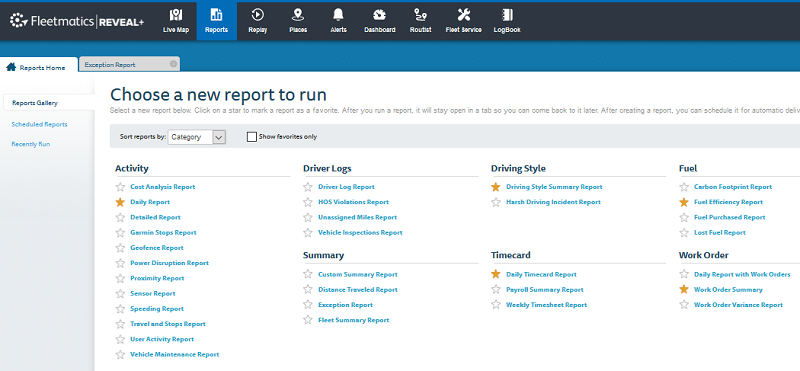
1. From the “Reports” tab, click “Exception Report” in the “Summary” column.
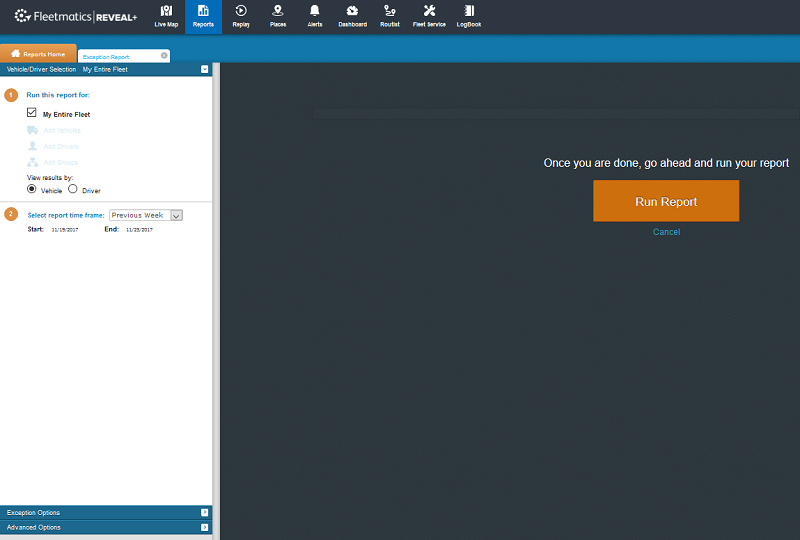
2. At left, pick which drivers or groups you’d like to see, or select the entire fleet. Choose which timeframe you’d like to see in the report.
a. Pro tip: you can customize your report under “Exception Options” and “Advanced Options” at bottom left. For the purposes of identifying long customer stops, choose “Show stops over x minutes.” You can then either exclude activity in geofences you want to ignore, or include activity in geofences at problem locations.
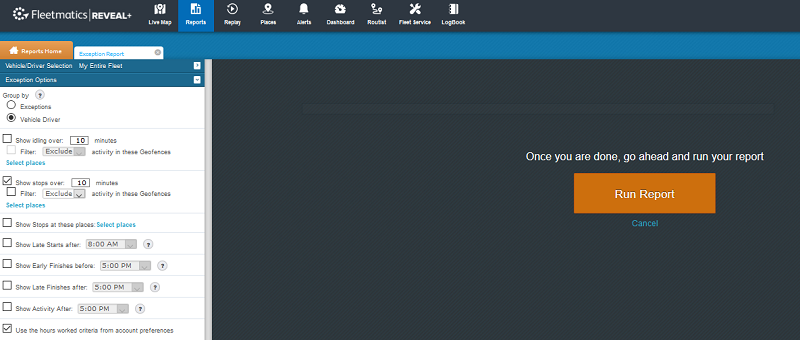
b. Click “Run Report” in the center of the page
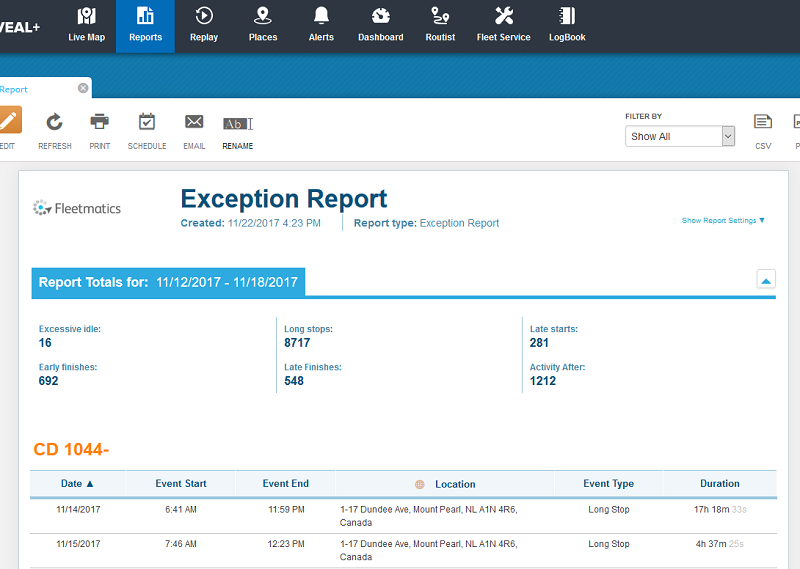
3. You can now see long stops by driver and see where they happened. You can print, email, export to CSV/PDF or schedule this report to be emailed to you automatically!
4. To take it a step further, you can find stops depicted in the exact way you’re reporting them to the FMCSA. It’s just as easy – here’s how:
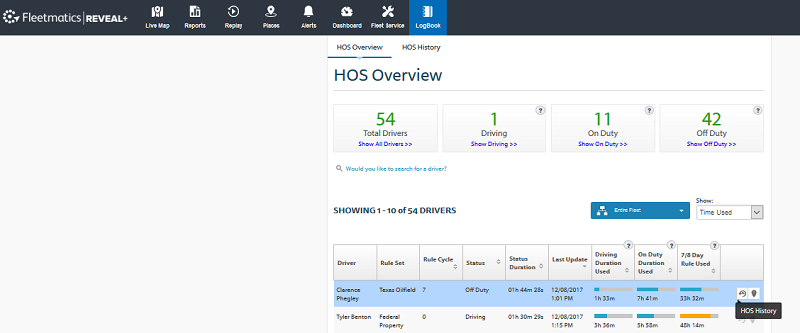
a. Click on the “LogBook” tab, and select “HOS History” for a particular driver. (Hover over the clock icon for that driver, as shown in the lower right of the photo below.)
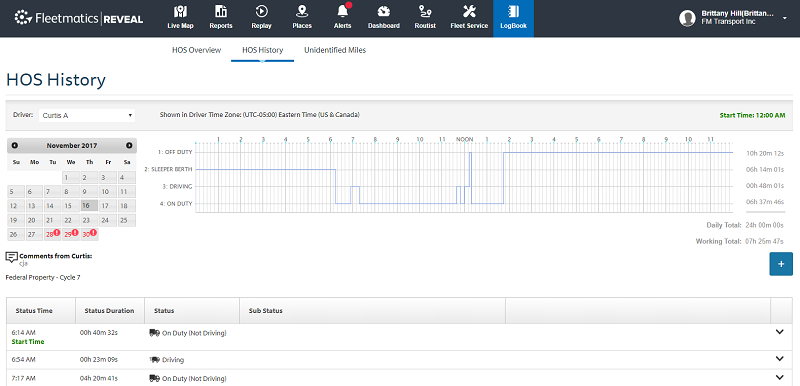
b. Using the calendar icon, choose the day you want to research. You can see in the chart where the driver had long on-duty stops (the row labeled “4: On Duty” shows when drivers were on duty but not driving. The list below the chart shows each of the status events for that driver on that day.
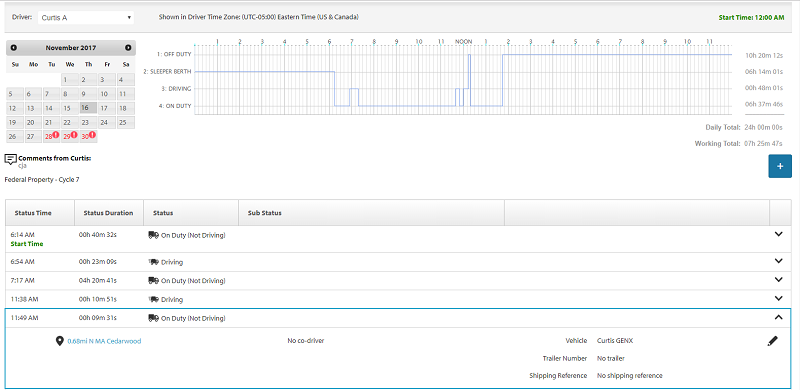
c. For even more detail on a particular stop, click the down-arrow button at the right of the display.
The result
Your team can now discuss long stops with customers, and your schedulers/dispatchers can plan accordingly. Faster stops mean more revenue!
Take your game to the next level
For even more productivity and efficiency gains, check out our route optimization solutions, the easiest way to create daily routes for your whole team at once.
What do you think?
Let us know how you’re using the Reveal platform and the LogBook platform in awesome ways – we’d love to feature you in our next Tales from the Road!
Whether it’s a new spin on this trick, or something you think the world has never seen before, hit us up!
Find out how our platform gives you the visibility you need to get more done.

Winning with ELD: Driving revenue with Logbook
Cash. Pocket change. Benjamins. Moola. Bacon. Paper. No matter what you call it, it still means one thing—money. And ...

Winning with ELD: Going Beyond Compliance
If the attendance at our recent ELD-focused webinars is any indication, many of you are still in investigation phase ...

Life After the ELD Mandate
If you’re still hoping the ELD mandate will be delayed or overturned, then American Trucking Association (ATA) Presid...

An ROI Checklist: Your Fleet Management Solution
To recognize true ROI from your fleet management solution implentation, it’s important to first define what it means ...